Spring 2021
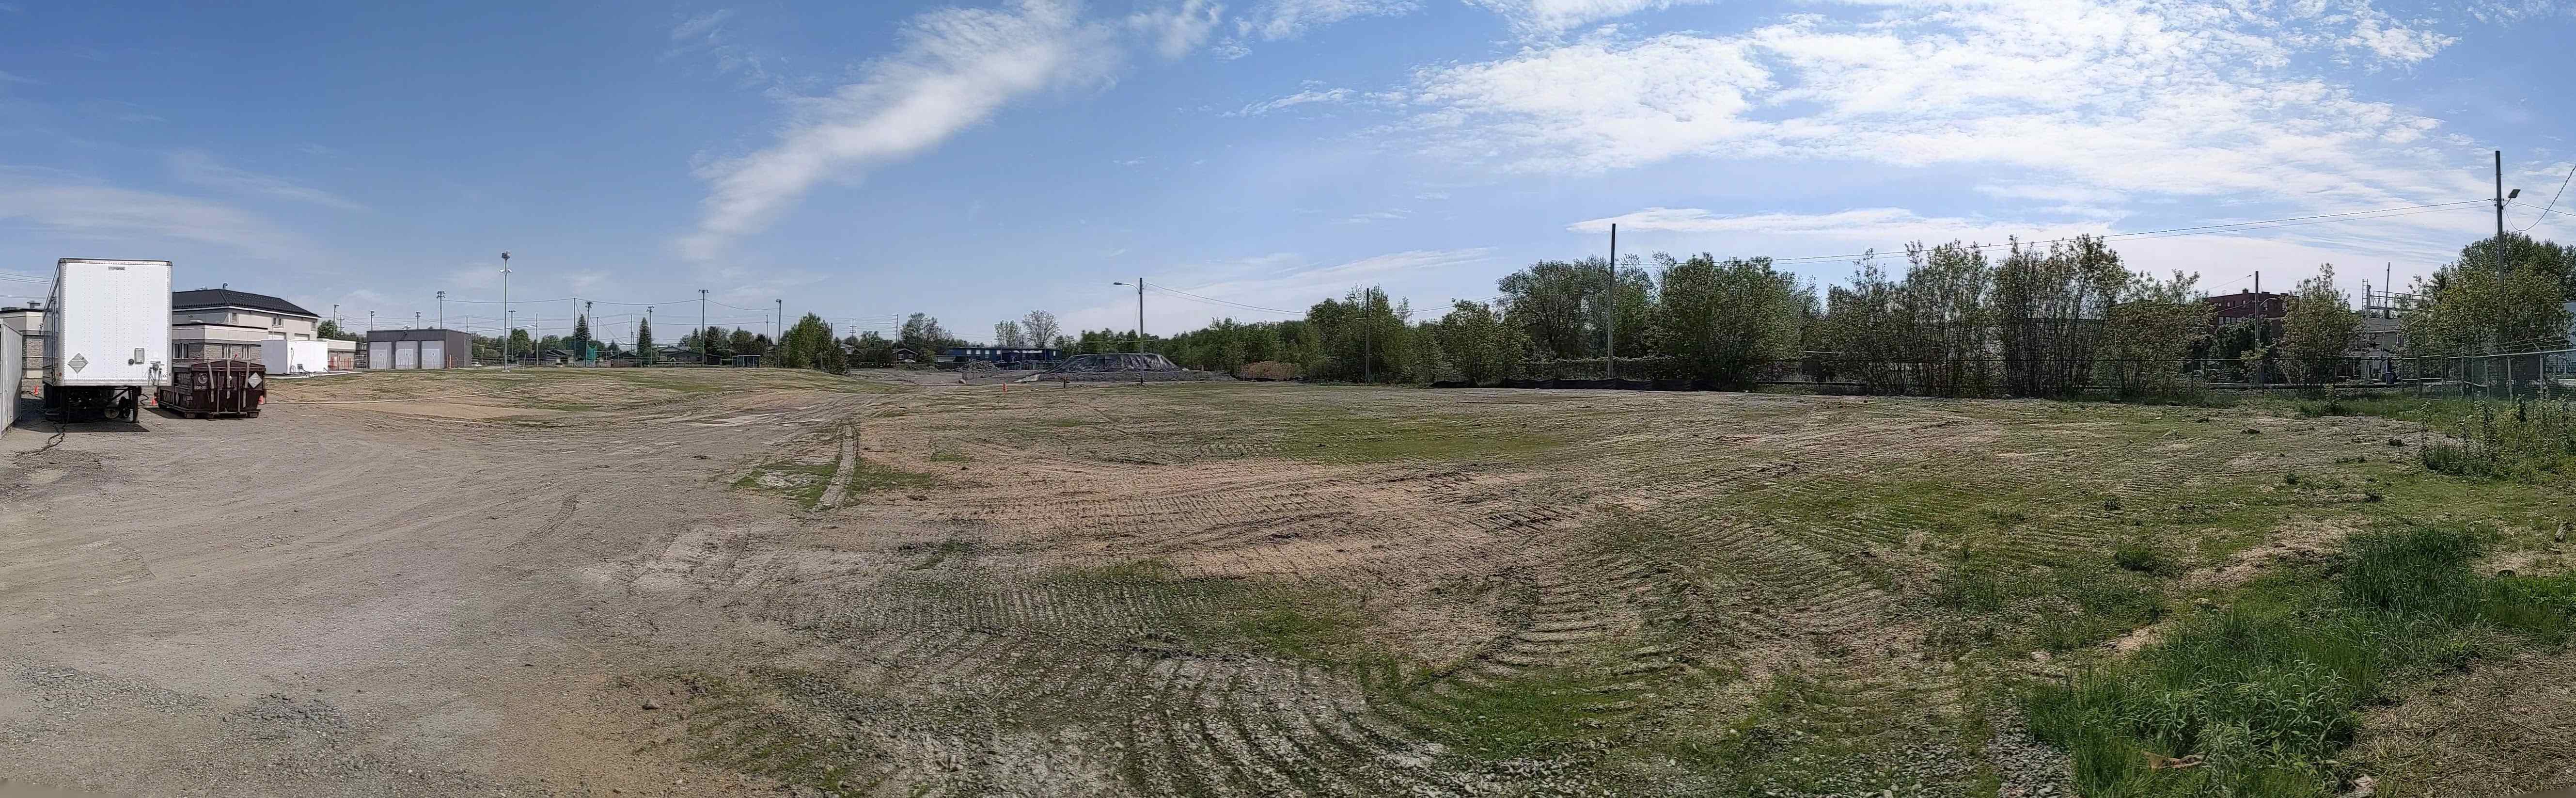
South Area
Before the start of the project
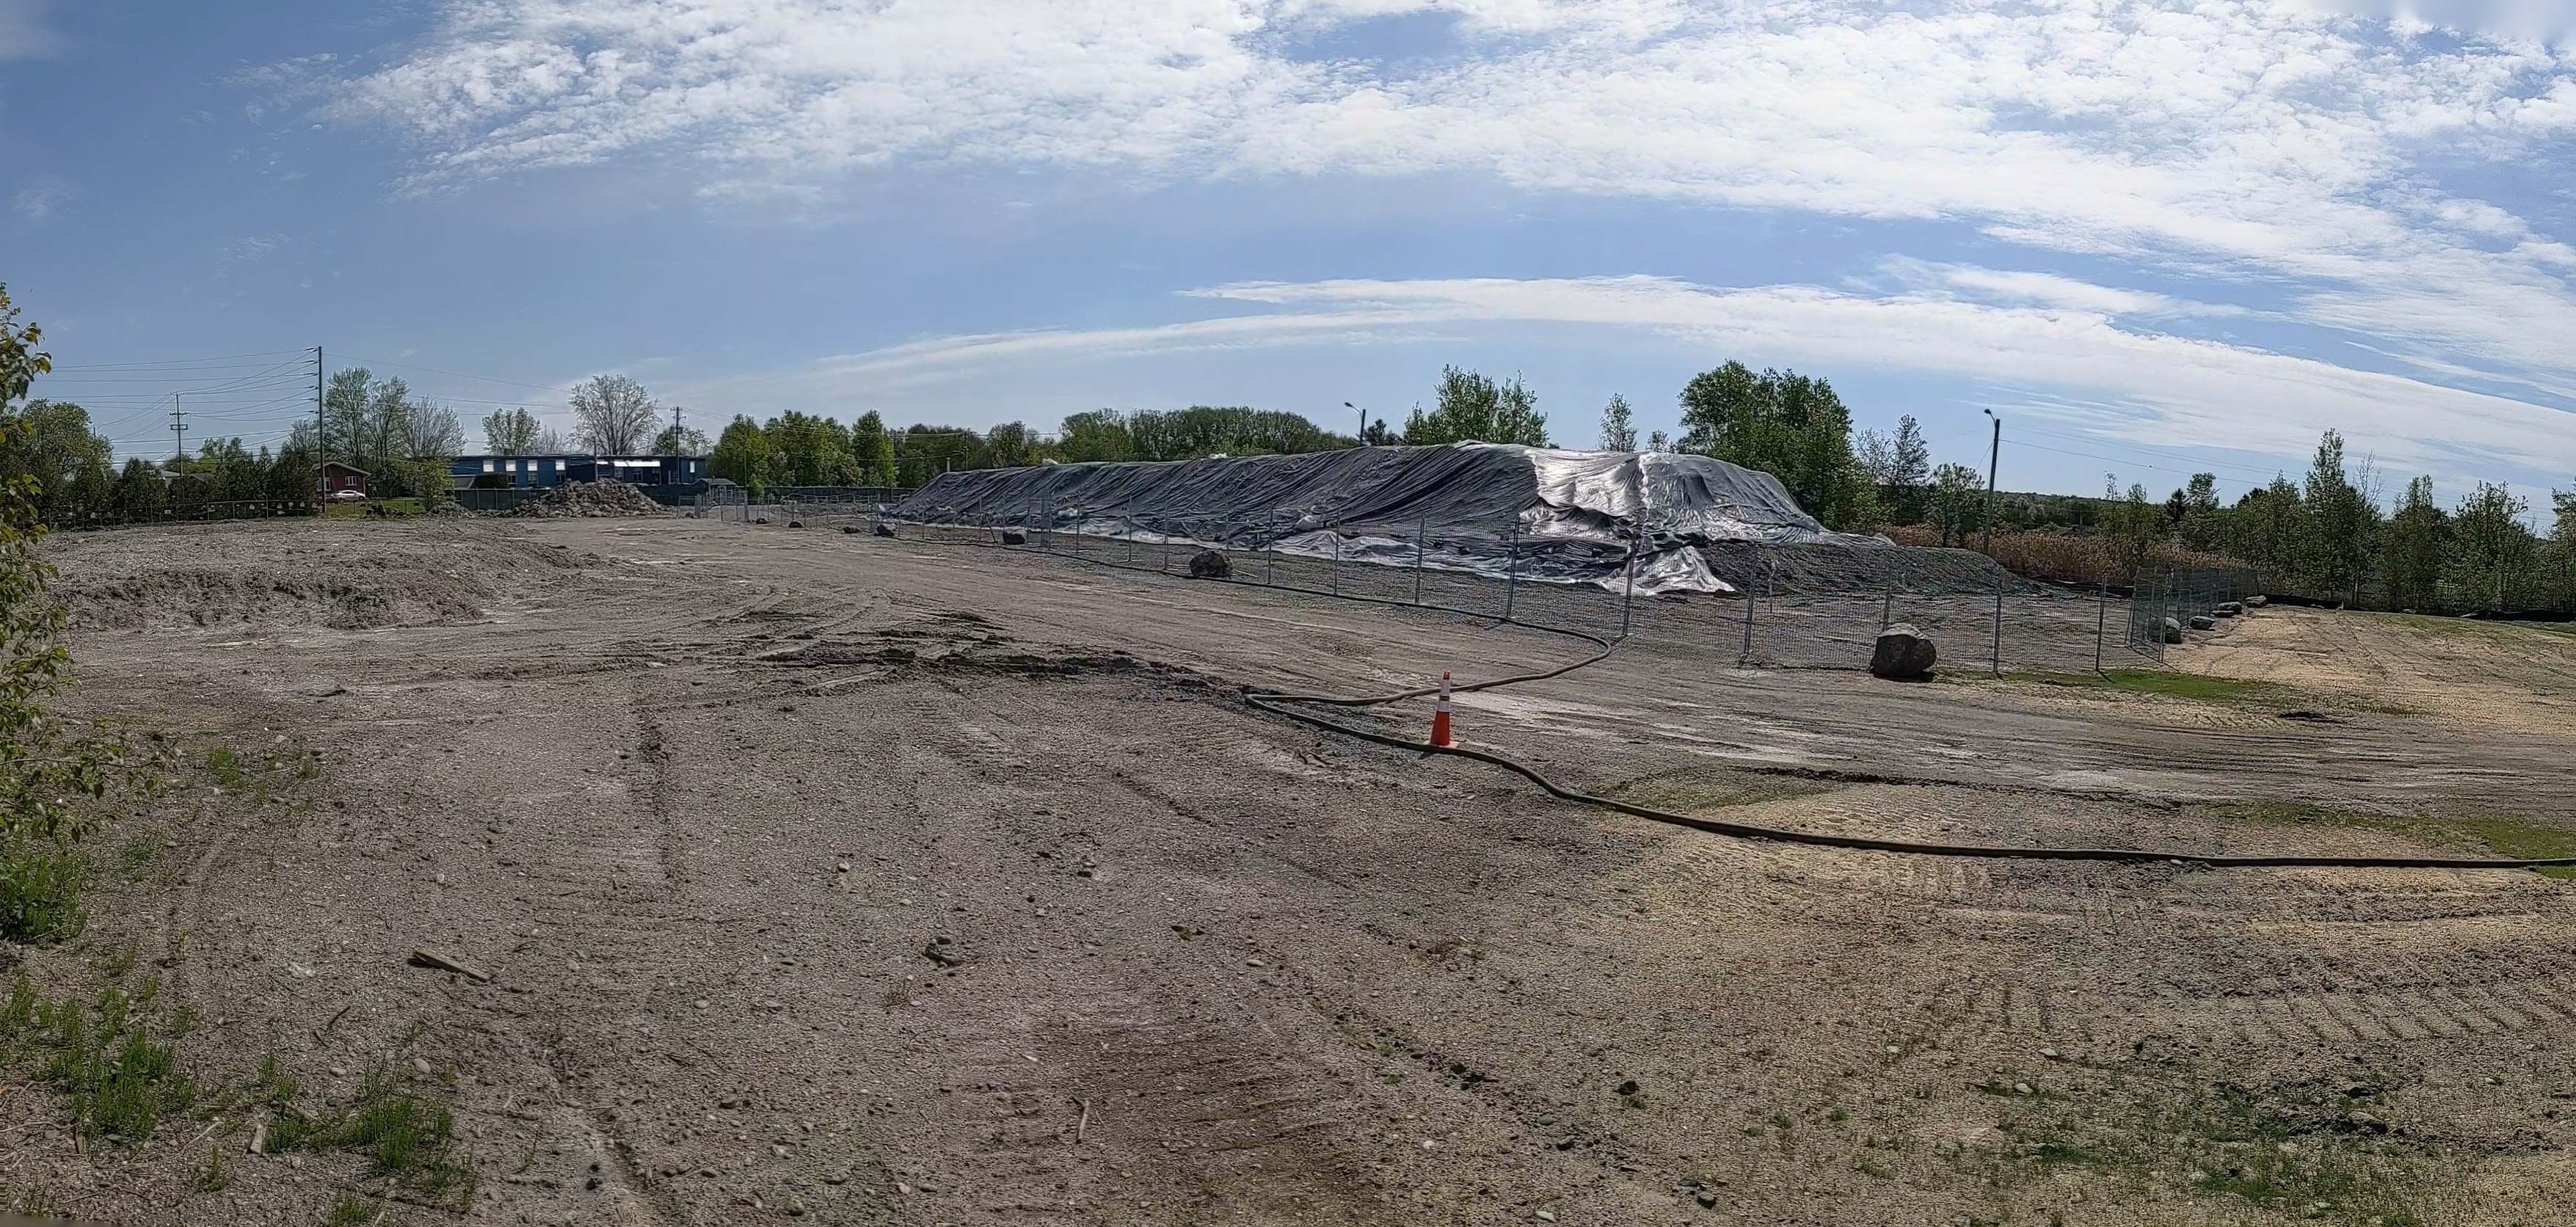
North Area
Before the start of the project
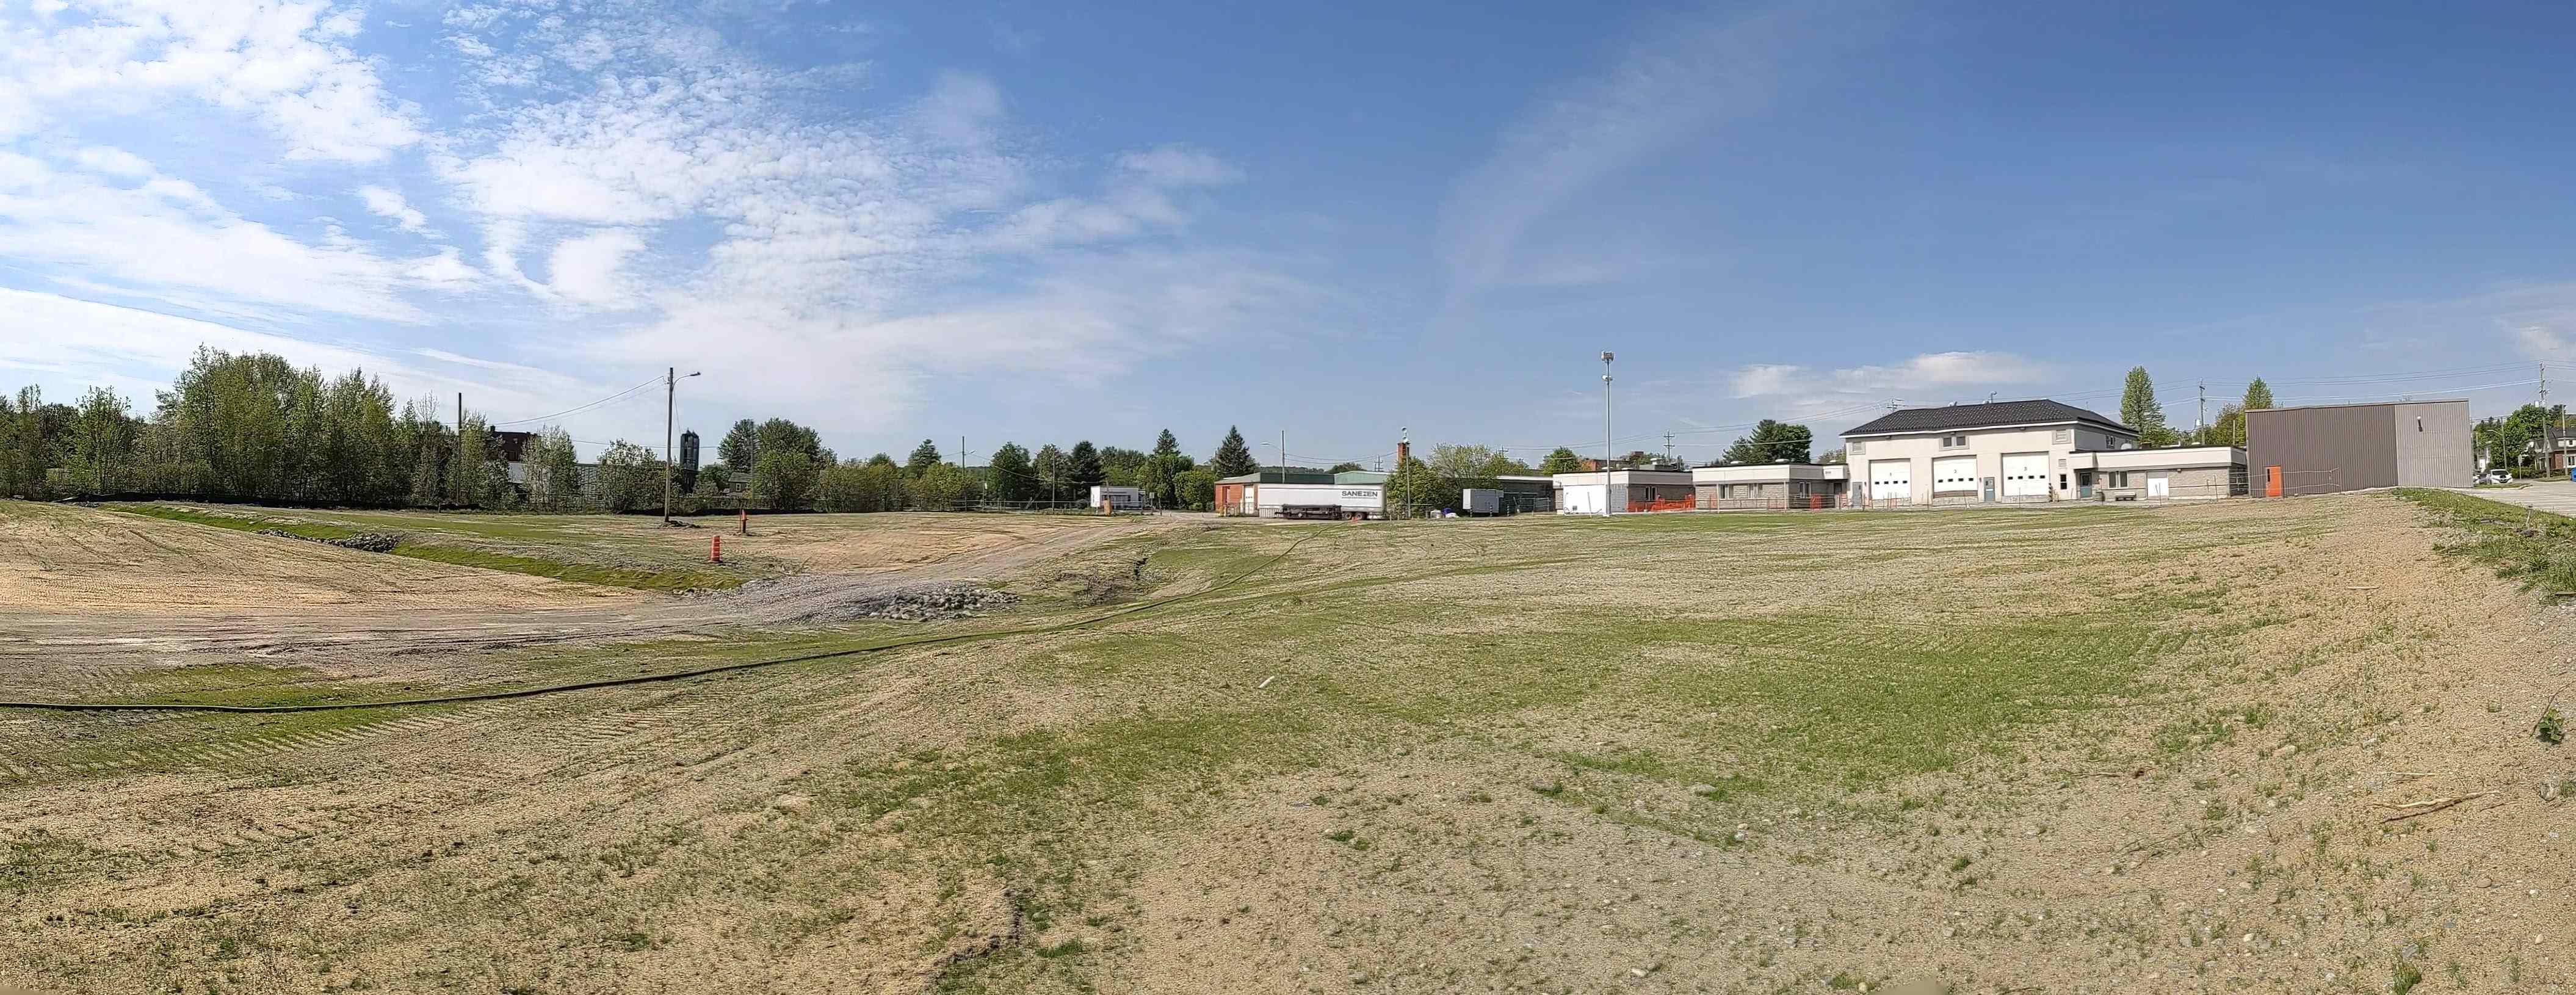
West Area
Before the start of the project
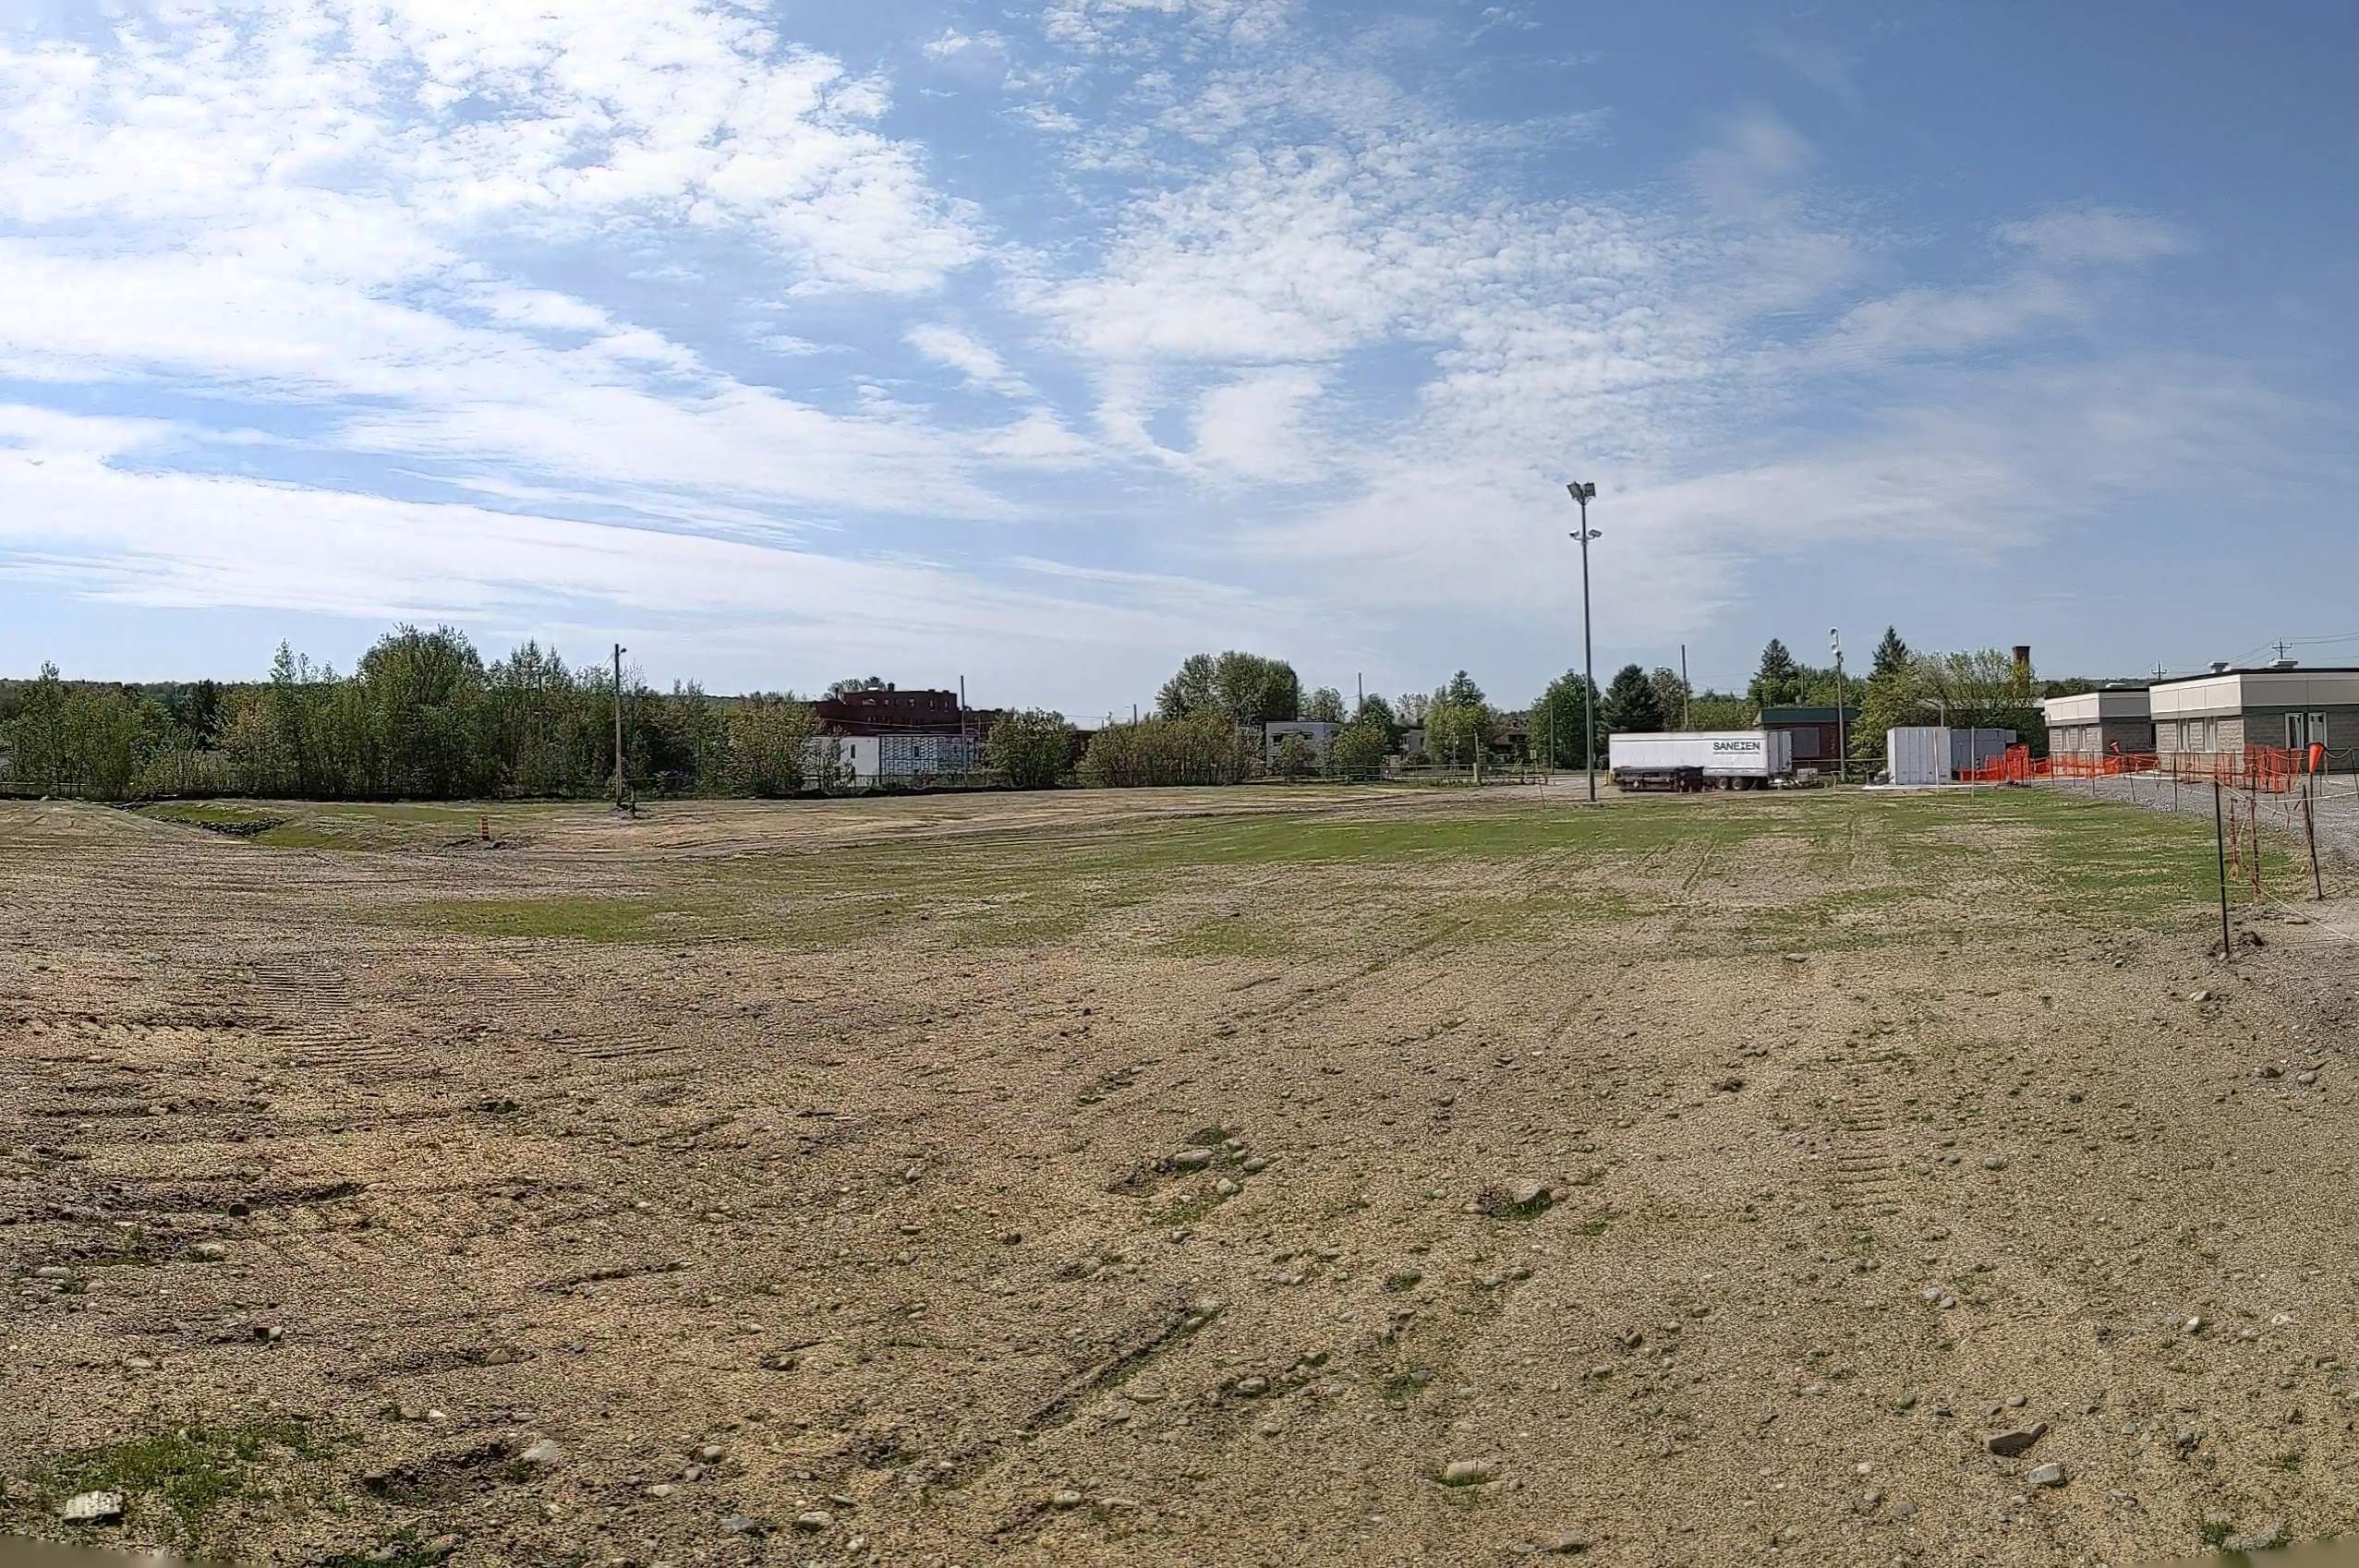
East Area
Before the start of the project
Summer 2021 summary results
In order to evaluate the urban heat island phenomenon in the neighborhood, the temperature from the sensors have been compared to the Environment Canada (EC) meteorological station located near Lac Memphrémagog.
The highest temperature registered by a sensor was 39.7 °C and the biggest difference between a sensor and the EC station was 11.7 °C. In average, the mean temperature difference between the highest value of a sensor and the EC station during the day (7 to 19h) was 4.9 °C and the lowest one was 1.3 °C. For the afternoon (12 to 17h), those numbers were respectively of 5.5 °C and 2.1 °C. The table below summarize the result for each study zone.
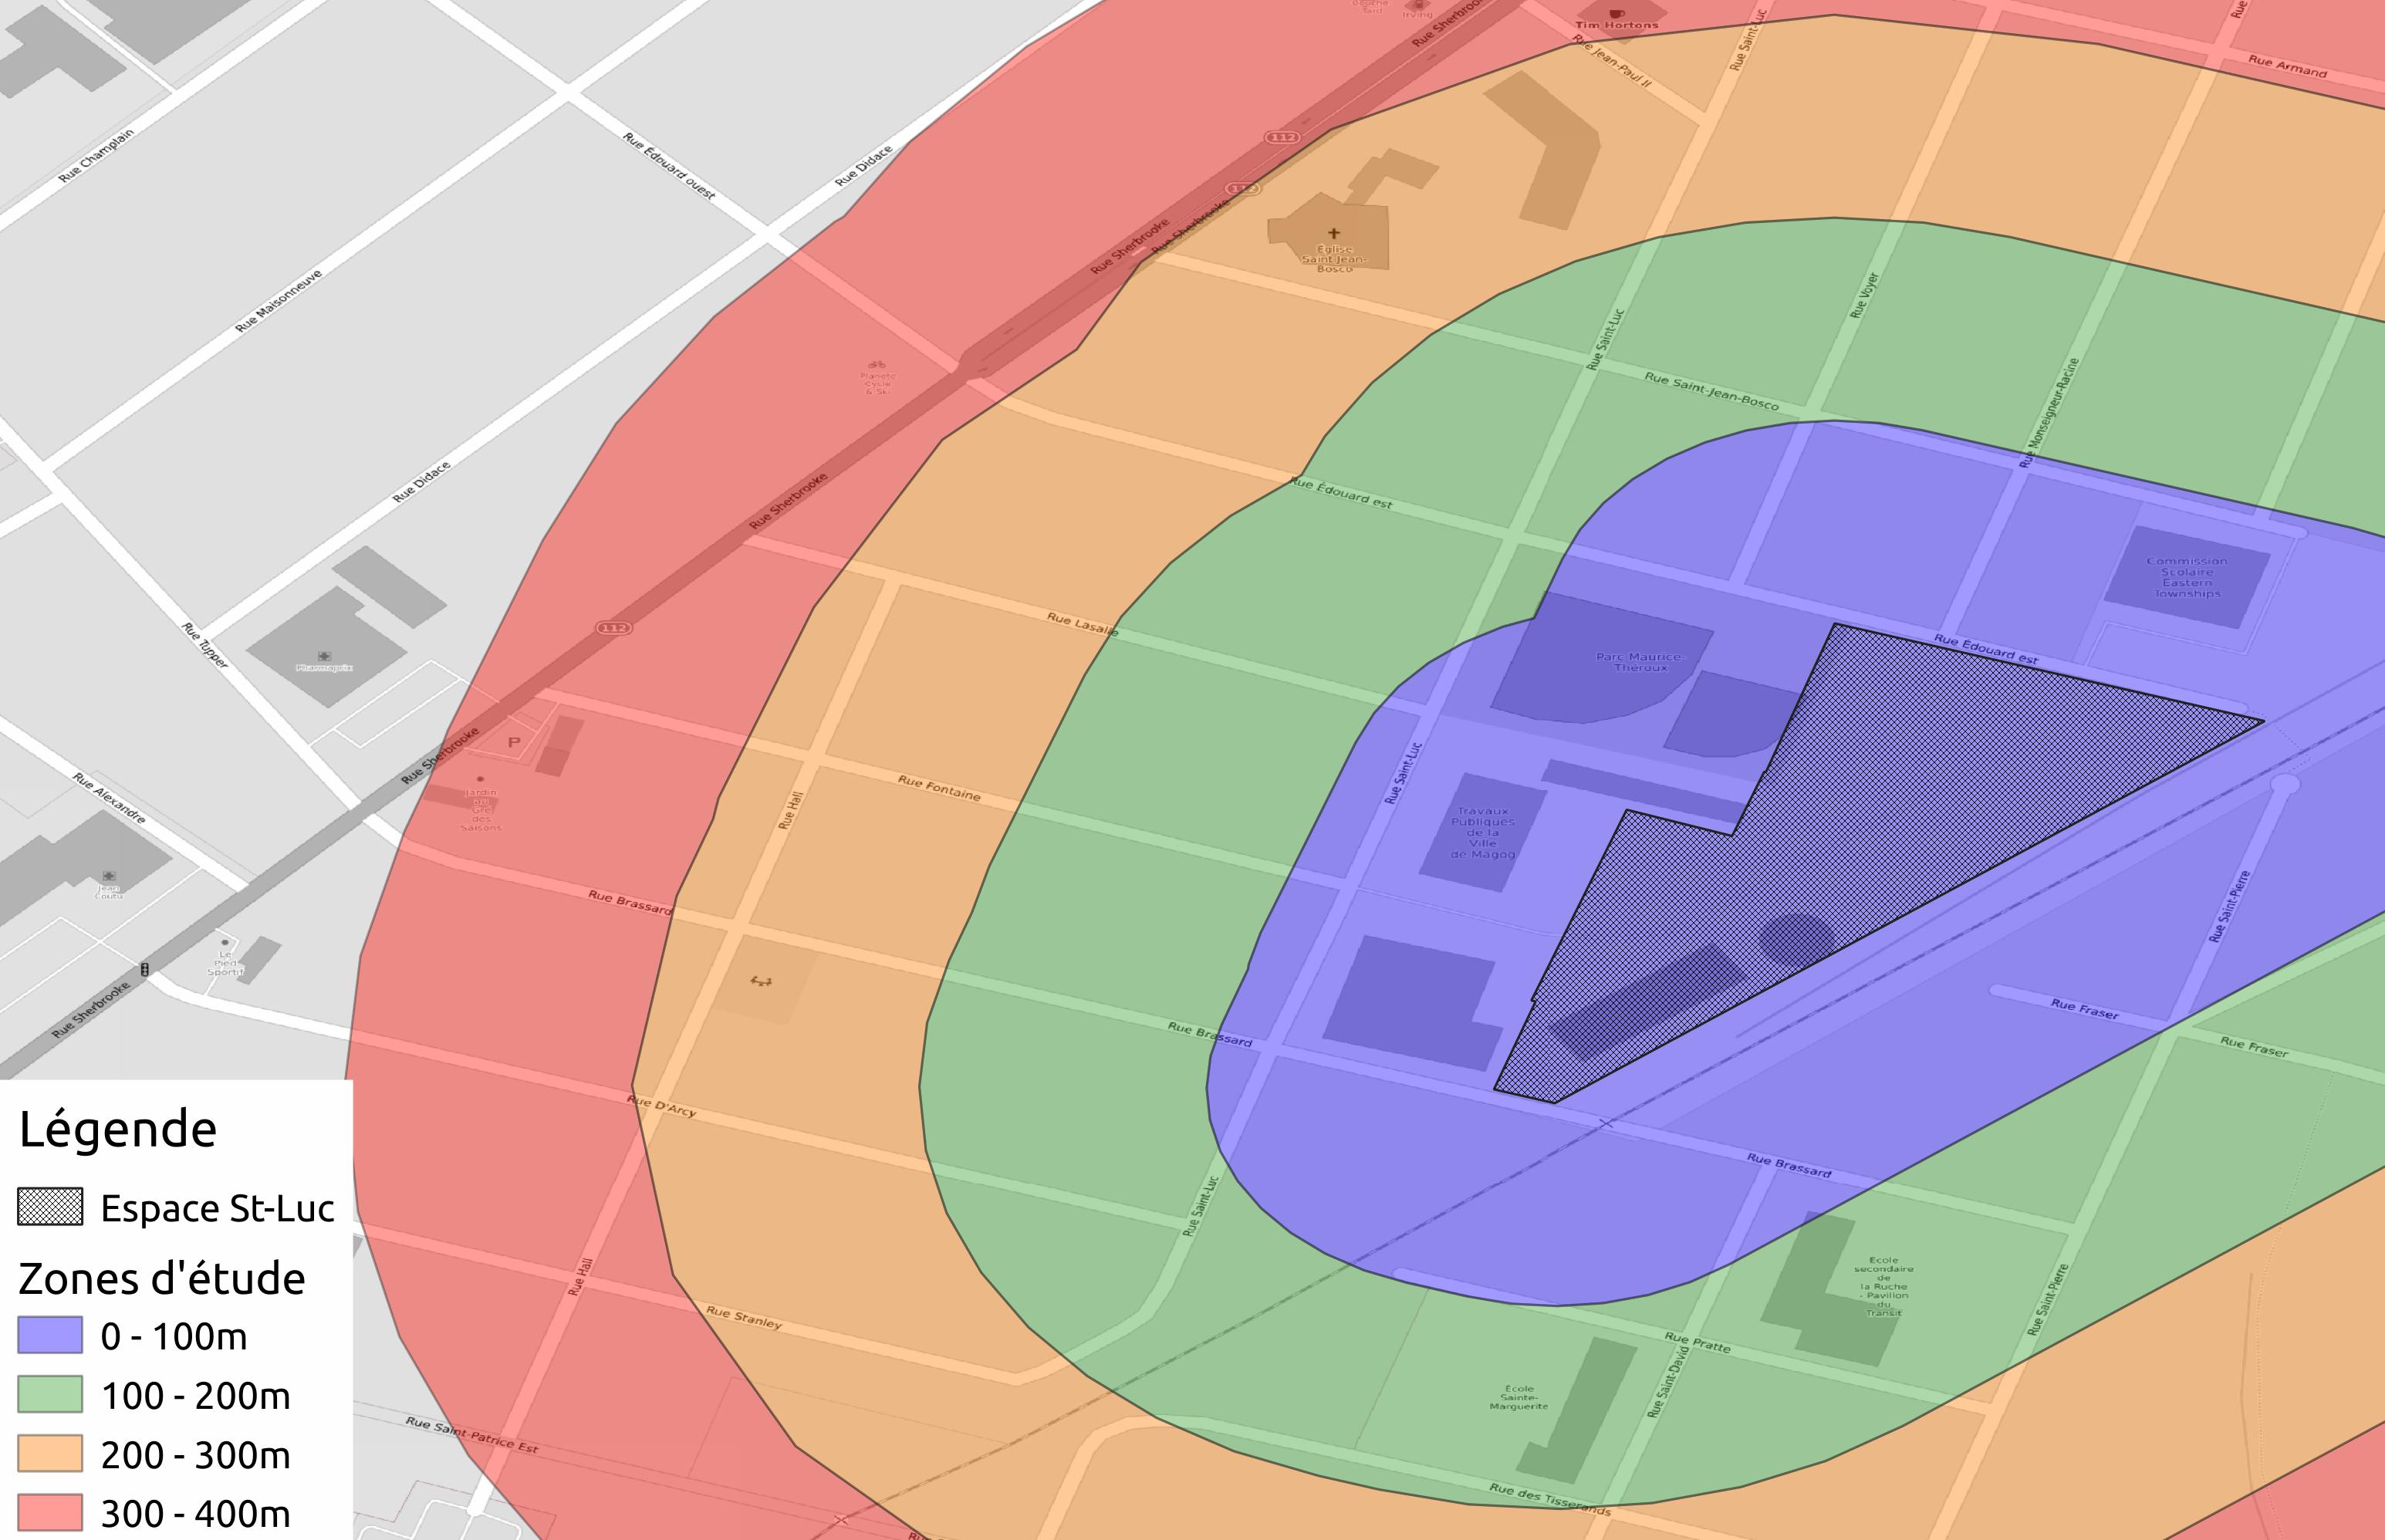
| Mean temperature difference between the EC station and the sensors | ||
|---|---|---|
| Day (7 to 19h) | Afternoon (12 to 17h) | |
| Zone between 0 and 100 metres | 2.7 °C | 3.5 °C |
| Zone between 100 and 200 metres | 2.6 °C | 3.2 °C |
| Zone between 200 and 300 metres | 3.2 °C | 3.7 °C |
| Zone between 300 and 400 metres | 3.5 °C | 3.8 °C |
| All sensors | 2.9 °C | 3.5 °C |
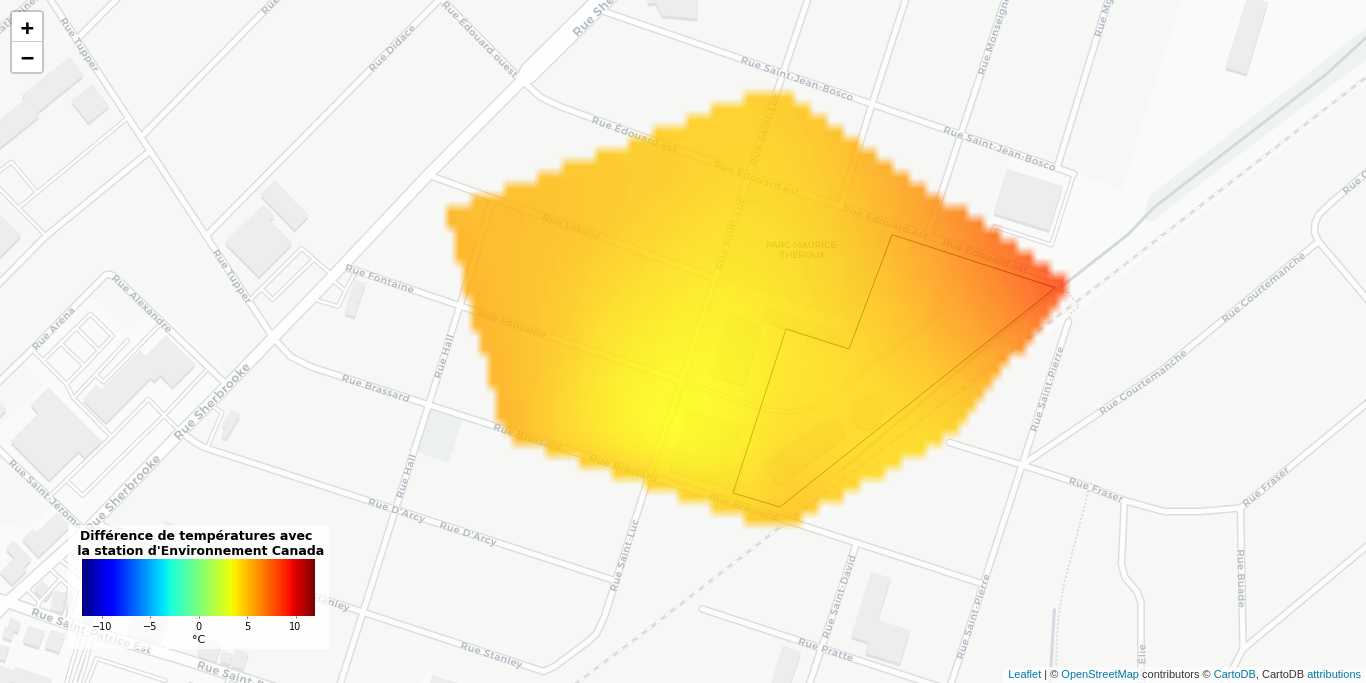
Maps below have been produced by interpolating the difference between the sensor’s temperature and the EC station’s temperature by using the cubic spline method. The exercise has been done for different base temperatures registered at the EC station (20 °C, 25 °C, 30 °C and the worst case of the summer with a temperature difference of 11.7 °C). It’s possible to notice a trend that shows the higher the temperature, the more significant the difference. Hence in a climate change future where temperatures will be higher, it is crucial to mitigate the urban heat island effect, which is the goal of this greening project.
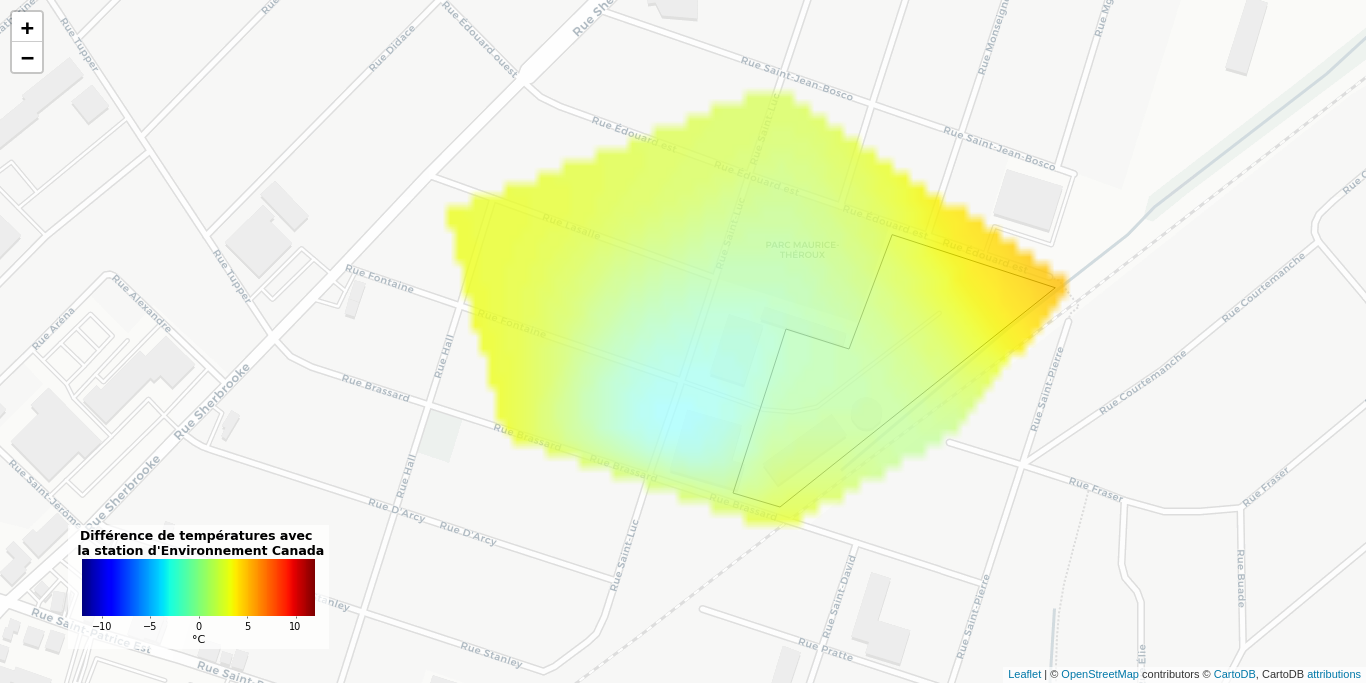
EC station at 20 °C
Summer of 2021
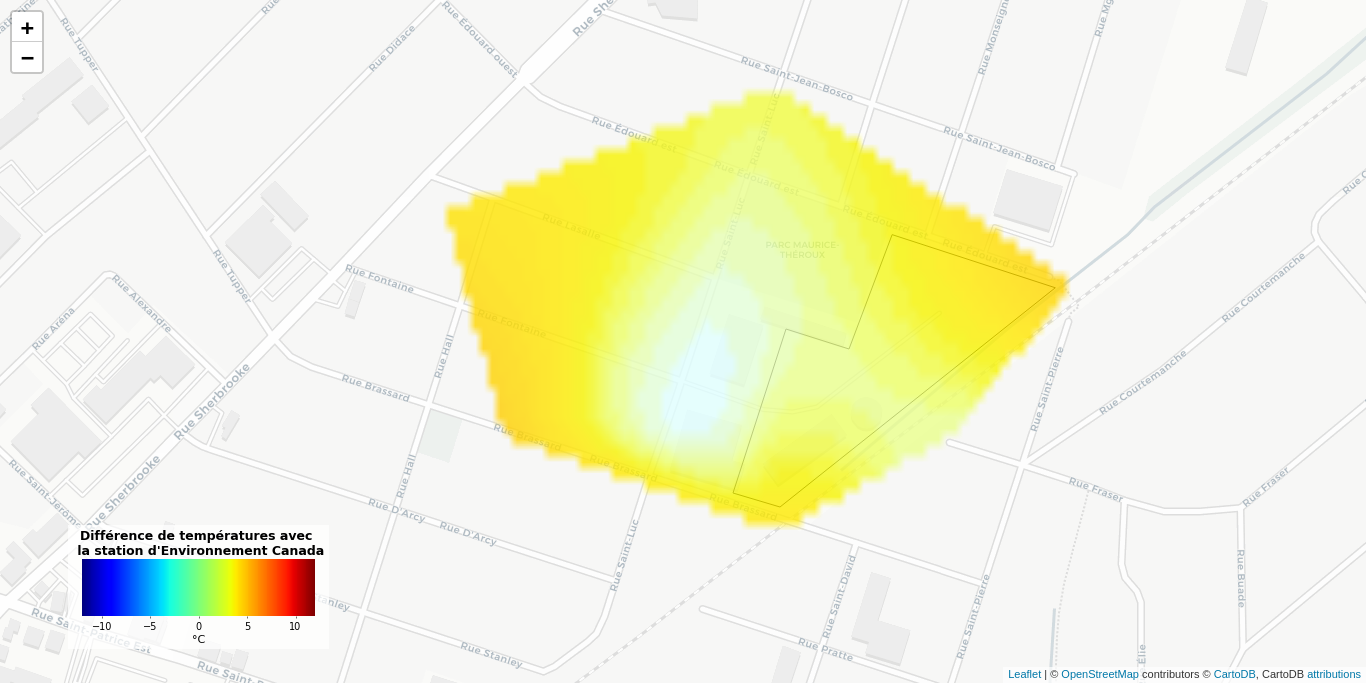
EC station at 25 °C
Summer of 2021

EC station at 30 °C
Summer of 2021
Difference of 11.7 °C with the EC station
Summer of 2021